The American Midwest has a long history of making stuff. During the 20th century, it was the manufacturing center for the nation, and indeed much of the world. It’s still where a surpassing majority of agricultural commodities are grown and processed. But is it also a major producer of technology startups? Maybe not as much as the coasts, but the Midwest’s bustling metropoli and vast expanses of rural land prove to be fertile ground for quite a bit of startup activity.
And that’s what we’re going to take a look at here. In a similar vein to our recent analysis of startup fundraising in the South, we’ll break down the region into its constituent parts, assessing deal and dollar volume trends in the Midwest’s two primary sub-regions, some of its individual states and the most active metropolitan areas in the U.S.’s midsection.
And, to be clear, this is not Crunchbase News’s first foray into the region. We’ve covered the region’s seed-stage interest in AI and hard tech, a few notable rounds and have always included the Midwest in all manner of data-spelunking expeditions. And to this, we’ll add a deep dive into the numbers.
Defining the midwest
Borders and boundaries are a deep well of disputes. To preempt debate, we use the U.S. Census Bureau’s definition of the Midwest region which, unlike its definition of the South, shouldn’t be too controversial. If you have something against Kansas or Ohio being included in this group, take it up with the Feds.
The good folks at the Census Bureau split the Midwest into two distinct — and rather unimaginatively named — sub-regions: the West North Central and East North Central states, which are separated by the Mississippi River. We’ve included the map below.
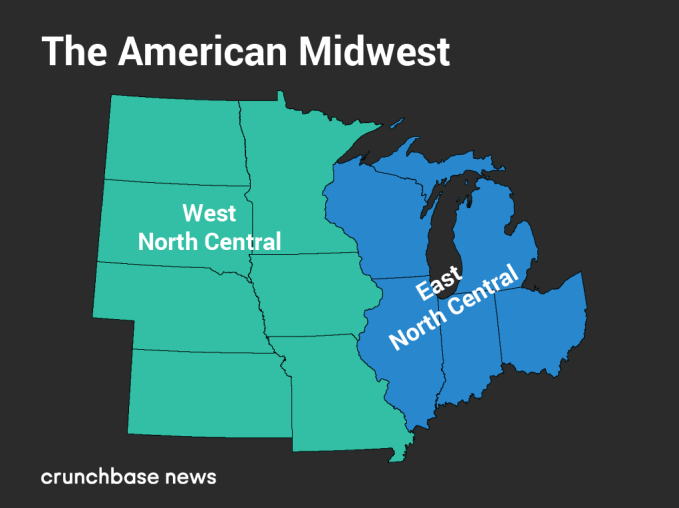
By splitting the Midwest into two distinct parts, we’ll be able to see where most of the startup and funding activity is concentrated. Spoiler alert: The farther west you go, the startup population (and the population itself) grows more scattered.
Capital flows into Midwestern startups
Based only on reported data in Crunchbase, the Midwest appears to be affected by the same phenomenon as the rest of the country. Crunchbase News has previously found that the number of seed and early-stage deals has gone off a cliff in the U.S., resulting in a top-heavy market featuring many large, late-stage deals. And this wouldn’t be a problem if it weren’t for a shortfall in new startups to fill the next cycle of early-stage funding. The “hollowing out” of the Midwestern venture deal pipeline becomes readily apparent when you look at funding data for the past several years, which you can find in the chart below.
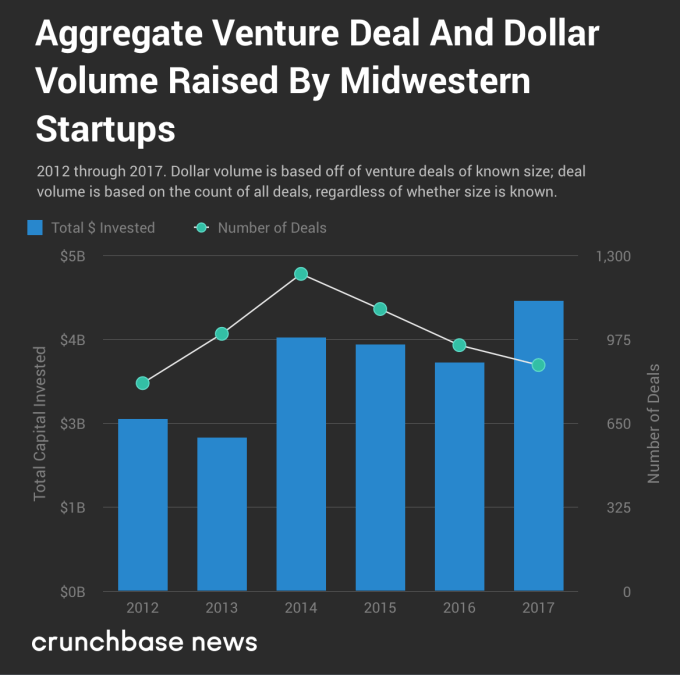
To wit, deal volume is down markedly since 2014, as Crunchbase News reported in its Q4 2017 report of startup funding activity in the U.S. and Canada. But somewhat counterintuitively, the amount of money being invested into startups is on the rise in the Midwest and throughout many other parts of the country, reaching fresh multi-year highs in 2017. Almost one full quarter into 2018, the trend appears to continue unabated.
But this chart abstracts away a lot of nuance, so let’s take a closer look at the region and its states.
Focusing in on Midwestern deal and dollar volume
We’ll start first with deal volume, because that’s a fairly decent indicator of a geographic region’s level of startup activity. Below, we’ve plotted venture deal volume, divided by sub-region.
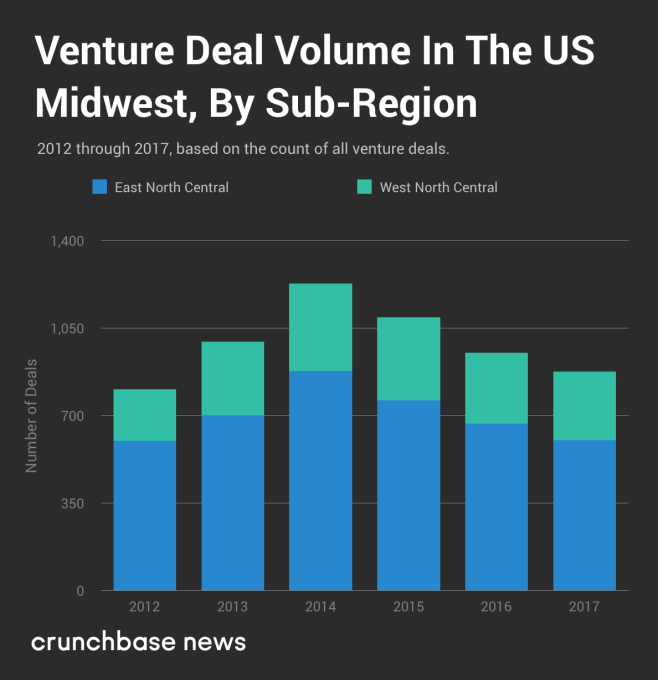
Again, based on the reported data from Crunchbase, we found that deal counts have been on a downward trend for several years. And though some of this may be attributable to reporting delays, projected deal volume data for the whole of the U.S. and Canada (fourth chart down in the Q4 quarterly report) shows a years’-long downtrend. There’s no reason to believe that startup activity in the Midwest is materially different from the rest of the U.S. and Canada.
But what about the relative “balance of power” between the two sub-regions? At least when it comes to deal volume, has one sub-region waxed while the other waned? To a limited extent, the answer is yes. Between 2012 and 2017, the percentage share of all Midwestern dealflow going to West North Central states like the Dakotas, Minnesota and Missouri has grown from 25.4 percent to 31.2 percent, up by nearly one-fifth in relative terms.
Now let’s check out dollar volume. The chart below displays aggregate reported venture capital dollar volume raised by startups in the Midwest.
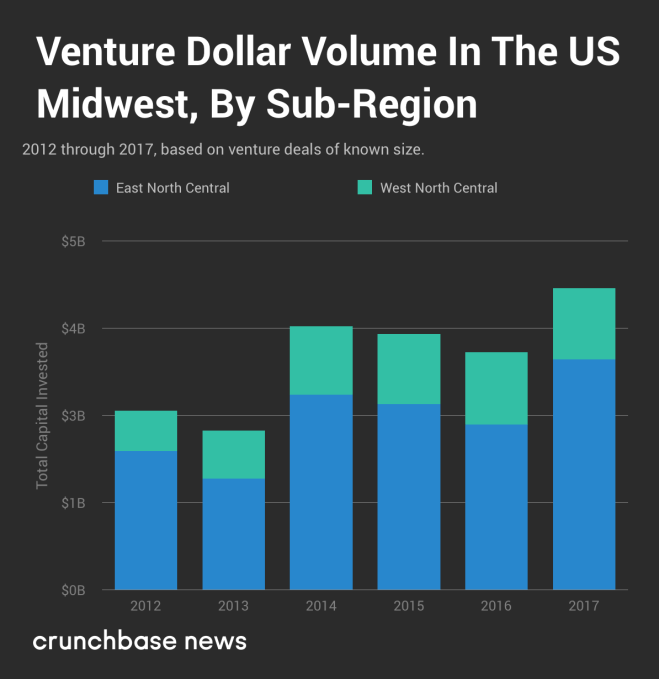
As far as the amount of money Midwestern startups have raised over time, the trendline is generally up and to the right. But that’s not the only way this differs from the deal volume data we looked at earlier. For dollar volume, there appears to be no appreciable change in the “balance of power” between the two sub-regions since 2012. Depending on the year, East North Central states like Illinois, Michigan and Ohio raked in between 70 and 78 percent of total dollar volume, but that variance doesn’t appear in an orderly trend.
Where are most Midwestern deals done?
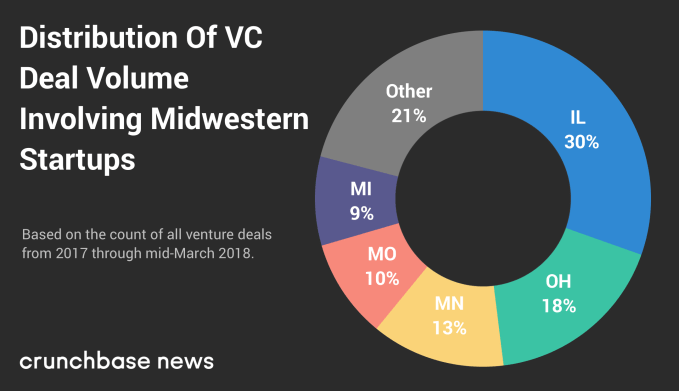
We started first at the regional level, then compared smaller groupings of states. Now, let’s see how deal and dollar volume is distributed on a state-by-state level. Doing so will point to the states that lead the region in venture-backed startup activity. Below, you’ll find a chart of how deal volume is split between the top five Midwestern states.
And here is how dollar volume is distributed.
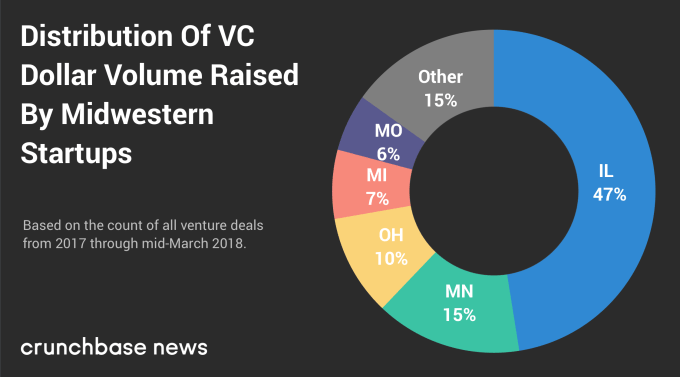
As we saw with our analysis of the South, the top five Midwestern states for deal volume are the same five top-ranked states for dollar volume. But there is some notable variation in how these states rank among each other and the amount of deal and dollar volume they account for.
Considering that Illinois is home to Chicago and a number of downstate universities with deep tech startup roots, the fact that it places first for both metrics shouldn’t come as much of a surprise.
What might be more of a head-scratcher is Minnesota, which ranks third in deal volume but second in dollar volume. Why does it switch places with Ohio? The answer could lie in the industrial mix which, in the case of Minnesota, includes a disproportionately high number of medical device and other life sciences companies, which typically take a lot of capital to get off the ground.
The top Midwestern startup cities
Longtime readers of Crunchbase News may remember a ranking of Midwestern startup cities we wrote back in August 2017. However, here we’re just focusing on deal and dollar volume over the past 15 months, since the start of 2017.
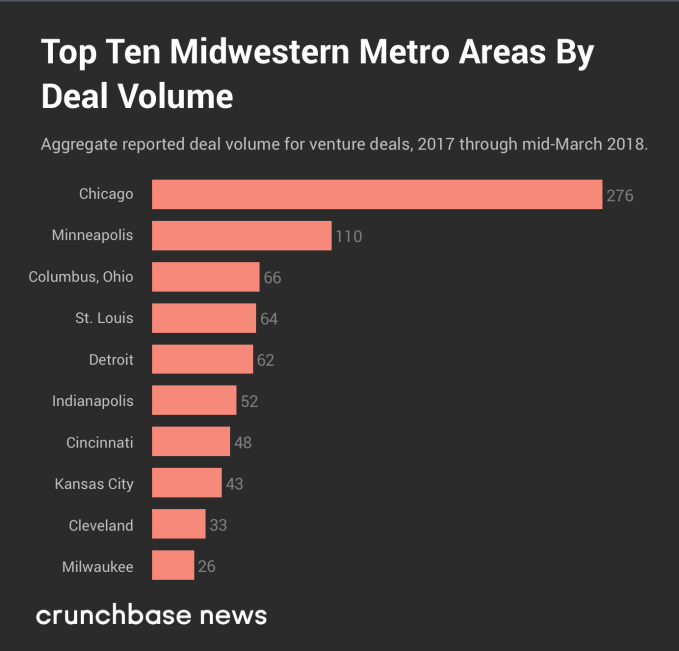
Let’s start first with the top 10 Midwestern cities as measured by number of startup funding rounds.
And in the chart below, you can see the top cities, as ranked by venture dollar volume, from the same period of time.
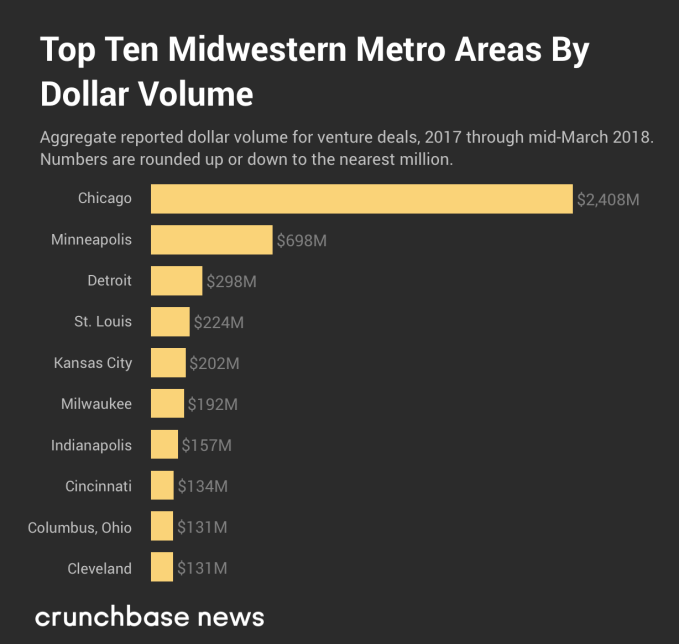
In both rankings, four of the top five cities are the same, but the odd one out appears to be Columbus, Ohio. Although there were a fairly large number of rounds raised by startups in that metro area, most of the rounds were fairly small by national standards. And one of the main reasons why Kansas City, Missouri jumped so much in the dollar volume rankings was a $100 million Series F round raised by C2FO.
But, again, as far as the Midwest goes, everything pales in comparison to Chicago alone.
For many, the Midwest is in a kind of Goldilocks zone. The East and West coasts seem to hold more or less equal sway over the culture and economy and most of its cities are neither too big nor too small. The only extreme it seems to occupy is its winter weather.
from Startups – TechCrunch https://ift.tt/2pFR0D8
via IFTTT
No comments:
Post a Comment
Thank You for your Participation