Jason Feldman, CEO of Canvs, said he has a big goal: “I think there needs to be a Google for emotions … where you can see how people feel about everything.”
Feldman argued that creating such a product, Canvs can not only help businesses make better decisions, but also contribute to “a more empathetic world.”
(When I pointed out that not everyone is comfortable with the idea of for-profit businesses having a detailed understanding of their emotions, particularly post-Cambridge Analytica, Feldman noted that Canvs isn’t involved in any kind of user targeting or attempts to change user behavior — instead, it’s all about “clarifying how people really feel about things.”)
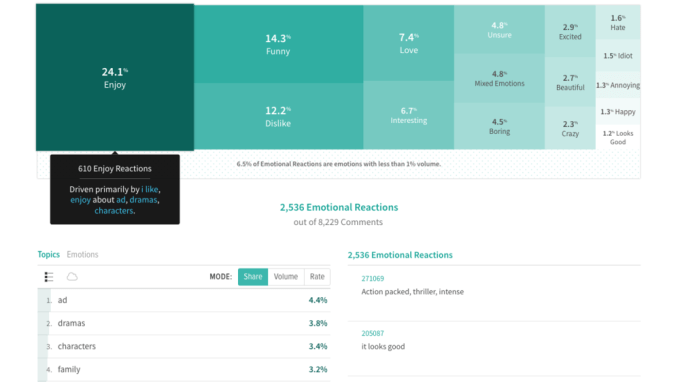
Canvs’ first product was focused on helping TV networks understanding the social media conversation about their shows, with what Feldman said is much greater nuance than normal social sentiment analysis. Now the company is taking the next step with the launch of Canvs Surveys.
Using this product, researchers collect survey data the way they normally do, but they can then upload an Excel spreadsheet of open-ended responses and quickly get a detailed breakdown of how people responded, in aggregate, to different characters, storylines and so on.

Feldman explained that while surveys are a common research tool for businesses, open-ended questions can be a big problem. Not only can it take an enormous amount of time to classify and tabulate all the different responses, but it also involves a degree of subjectivity, based on how individual researchers interpret each answer.
At the same time, it’s the open-ended questions that can provide the most meaningful insights. For example, Feldman said Canvs works with NBCUniversal and found that three of the network’s pilots got similar responses when it came to the “closed ends” (namely, the survey questions where respondents choose from a menu or numerical scale of possible answers).
It was only in the open-ended questions that you could see meaningful differences — Feldman said that ultimately, it turned out out that the shows that “overperformed for ‘enjoyment’ and underperformed for ‘interesting'” did well with viewers, while the shows that respondents saw as more interesting than enjoyable did poorly in the ratings.
Feldman argued that this is an insight that applies to companies beyond TV.
“For every single industry now, because of the Internet, because of how many choices we have, the only thing that gets people to do something is an emotional connection,” he said. “That’s the rub.”
He added that a tool like Canvs Surveys doesn’t replace the work of researchers. Instead, he argued that it reduces the “manual work” and makes them “more focused on what they’re really good at, which is insights and storytelling.” (Plus, researchers who want to go deeper can dig into the individual responses and flag answers that weren’t classified correctly.)
It seems that NBCUniversal is happy with the results. The company’s senior director of program reserach Benoit Landry said in the announcement:
Having just wrapped up our first pilot testing using Canvs Surveys, I can say with confidence this isn’t an iterative improvement for the research community, it’s a first-ever. We went from spending 16 hours trying to hand sort open-ended survey responses, down to one hour with Canvs, and that’s in addition to never-before-seen normative insights across pilots. It’s an extraordinary efficiency gain and cost savings for NBC for something we do dozens of times each year.
Canvs Surveys is available for free for researchers analyzing up to 5,000 open-ended responses.
from Startups – TechCrunch https://ift.tt/2JEhJc9
via IFTTT
No comments:
Post a Comment
Thank You for your Participation